In this article we look at some performance gains that are achieved in Spark using the CMR API configured with the JBoss Infinispan distributed cache. We have two examples to explore — the first includes a simple performance comparison using the CMR API, with and without caching enabled, to execute queries against the Federal Reserve Bank of St. Louis FRED web services; the second example goes a bit further into the performance improvements when caching is enabled.
The example we cover below pertains to RESTful web service calls exclusively and not streaming data — for streaming data, see Apache Flink.
Example One
In this example we compare two calls to the Federal Reserve Bank of St Louis — the first set of queries does not have caching enabled whereas the second set does. We execute the same query, below, with no other modifications; queries without caching configured were executed by hand over the course of a day and the results do not include connection timeouts, which amounted to ~ 20% of all queries.
Here is the full Spark script:
val key = System.getenv("FRED_API_KEY")
import com.coherentlogic.fred.client.core.builders.BuilderDecorators._
import com.coherentlogic.openfigi.client.core.builders.BuilderDecorators._
import com.coherentlogic.cmr.api.builders.CMR
val cmr = new CMR ()
cmr
  .fred
  .series
  .observations
    .withSeriesId("CSUSHPINSA")
  .doGetAsObservationsDataset(spark)
Without Caching @ 50 Hits:
Method performance: JAMon Label=doGetAsObservationsDataset, Units=ms.: (LastValue=374.0, Hits=50.0, Avg=651.52, Total=32576.0, Min=128.0, Max=7614.0, Active=10.0, Avg Active=5.04, Max Active=11.0, First Access=Mon May 14 11:21:10 EDT 2018, Last Access=Mon May 14 15:39:14 EDT 2018)
Without Caching @ 100 Hits:
Method performance: JAMon Label=doGetAsObservationsDataset, Units=ms.: (LastValue=130.0, Hits=100.0, Avg=819.78, Total=81978.0, Min=116.0, Max=10664.0, Active=20.0, Avg Active=10.77, Max Active=21.0, First Access=Mon May 14 11:21:10 EDT 2018, Last Access=Mon May 14 19:28:01 EDT 2018)
With Caching @ 50 Hits:
Method performance: JAMon Label=doGetAsObservationsDataset, Units=ms.: (LastValue=0.0, Hits=50.0, Avg=39.42, Total=1971.0, Min=0.0, Max=1912.0, Active=0.0, AvgActive=1.0, Max Active=1.0, First Access=Mon May 14 19:47:19 EDT 2018, Last Access=Mon May 14 19:47:34 EDT 2018)
With Caching @ 100 Hits:
Method performance: JAMon Label=doGetAsObservationsDataset, Units=ms.: (LastValue=0.0, Hits=100.0, Avg=41.6, Total=4160.0, Min=0.0, Max=4106.0, Active=0.0, Avg Active=1.0, Max Active=1.0, First Access=Mon May 14 19:41:00 EDT 2018, Last Access=Mon May 14 19:41:26 EDT 2018)
See also CMR Performance Comparison With and Without Infinispan for a direct link to the Google Sheet above.
Example Two
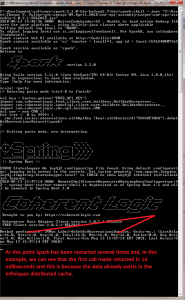
In this example the CMR API has been configured with the Infinispan shared memory data grid. The first call to the Federal Reserve Bank of St. Louis (Fed) RESTful web services, which is not shown here, took a little over nine seconds to process the full request for data.
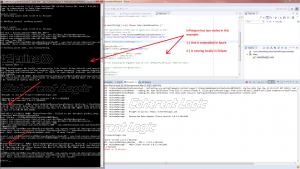
In this example there are two nodes running:
1.) One is embedded in the Spark instance
2.) One is in the Eclipse instance
So how is it that after starting Spark from the command line, that the first call to the Fed for data in this example only took 16ms?
The answer is that the data was already available in the Infinispan node running in Eclipse, so instead of making a full web service call to the Federal Reserve, the CMR API just grabbed the data locally and returned that.
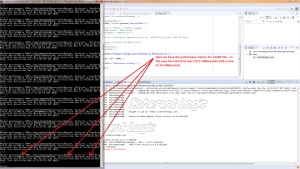
The improvement in performance with this approach is significant. In this example, the same query has been invoked 1000 times and the result is that it only took 313ms to execute — the full JAMon method performance is here:
cmr.fred.series.observations.withSeriesId("CSUSHPINSA").doGetAsObservationsDataset(spark)
Method performance: JAMon Label=doGetAsObservationsDataset, Units=ms.: (LastValue=1.0, Hits=1002.0, Avg=0.312375249500998, Total=313.0, Min=0.0, Max=16.0, Active=0.0, Avg Active=1.0, Max Active=1.0, First Access=Sun May 13 13:28:38 EDT 2018, Last Access=Sun May 13 13:35:59 EDT 2018) (edited)
The Spark instance can be terminated and started it again ad infinitum and the performance for any calls like this will be extremely fast and this performance gain is the same for anyone on the same network who also has the cache running with the same configuration.
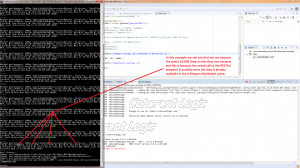
Below we have the results for requesting the same data 11000 times for a total of 2142 milliseconds spent.
Method performance: JAMon Label=doGetAsObservationsDataset, Units=ms.: (LastValue=1.0, Hits=11000.0, Avg=0.19472727272727272, Total=2142.0, Min=0.0, Max=36.0, Active=0.0, Avg Active=1.0, Max Active=1.0, First Access=Sun May 13 13:59:37 EDT 2018, Last Access=Sun May 13 14:09:29 EDT 2018)
Finally, Spark is restarted and the same query is executed 1000 times for a result of 303ms spent.
— the full JAMon performance breakdown appears below:
Method performance: JAMon Label=doGetAsObservationsDataset, Units=ms.: (LastValue=0.0, Hits=1000.0, Avg=0.303, Total=303.0, Min=0.0, Max=19.0, Active=0.0, Avg Active=1.0, Max Active=1.0, First Access=Sun May 13 14:29:01 EDT 2018, Last Access=Sun May 13 14:30:02 EDT 2018)
Below are several other examples with notes included directly in the images. Comments and questions are welcomed.
See Also
- FRED Client
- Coherent Data Adapter: US Treasury Direct Client
- World Bank Client
- Coherent Data Adapter: OpenFIGI Client Edition
- Coherent Data Adapter: Quandl Client Edition
- USA Spending Client
- Coherent Datafeed: Thomson Reuters Edition
- Coherent Data Adapter: CUSIP Global Services Web Edition
- CMR: Rapid Data Acquisition for the Apache Spark Cluster Computing Platform
- Coherent Logic Enterprise Data Adapter


